The DMAC Process
North Carolina has one of the most robust state-level drought monitoring processes in the country, considering dozens of different indicators and impacts each week to create the official state drought assessment and recommendations to the US Drought Monitor.
While this process works like a well-oiled machine thanks to its weekly regularity and years of experience among participants, it remains detailed and data-driven in order to address the challenge of keeping up with drought in North Carolina and informing those affected by it.
This page provides an overview of the drought monitoring process used by the NC Drought Management Advisory Council, from the history of the Council to the indicators reviewed each week to how a final assessment is produced and shared.
A History Defined by Drought
A group of water resources professionals formed the North Carolina Drought Monitoring Council in 1992 to assess drought conditions in the state. Its responsibilities and membership were refined during two significant droughts that affected the state over the next 15 years.
Following the long-lasting drought from 1998 to 2002, the General Assembly recognized the Council’s leadership and performance, and gave it important new responsibilities including implementing rules governing water supply planning, water conservation and water reuse during drought and other water emergency situations for water supply systems, and other water users.
In 2003, North Carolina General Statute 143.355.1 was ratified, tasking the newly renamed Drought Management Advisory Council with issuing official, objective drought status advisories based on technical data to help local officials plan their own management responses.
Just four years later, another devastating drought encompassed the state and dwindled water supplies to alarmingly low levels. In response, the General Assembly passed Session Law 2008-143, which made implementation of water shortage response plans mandatory for water systems and provided the Department of Environmental and Natural Resources with approval and oversight authority.
Underscoring the importance of having accurate assessments amidst a drought, this statute also required the DMAC’s representatives to have expertise or responsibility in meteorology, hydrology, water system management, emergency response, or another subject area related to the assessment and management of drought impacts. It also established the role of a council Chair, to be held by an employee of the Department of Environmental Quality (DEQ).
That set the stage for the modern DMAC, whose membership consists of state and federal agencies and organizations, and whose mission as mandated by state law remains providing consistent and accurate information on drought conditions in the state to the US Drought Monitor, the Environmental Management Commission, the Secretary of the Department of Environmental Quality, the Environmental Review Commission, and the public.

Precipitation Portrayed
The cause of – and cure for – any drought event is all about precipitation, initially in short supply and later sufficient for recovery. For that reason, each drought call begins with a review of recent rainfall, led by the North Carolina State Climate Office.
Weather stations equipped with rain gauges are an ideal source of precipitation data. Stations can be deployed for many different purposes – assisting air traffic, monitoring for forestry and fire danger, or learning more about our overall climate – but all can measure precipitation and put recent observations into a historical context, such as how far above or below normal an area is at a particular time of year.
To help fill in the gaps between stations, we can also look at high-resolution gridded precipitation estimates based on weather radar data and calibrated using surface rain gauge observations. Along with rainfall totals, this dataset includes the departure from normal and percent of normal precipitation, and objective drought indices such as the Standardized Precipitation Index, calculated across multiple timescales ranging from the past seven days to the past twelve months.
In the short term, a lack of precipitation over the past week to month can cause surface-level dryness to appear, while sustained deficits over many months typically means more entrenched dryness and drought that can affect water supplies.
In addition to quantifying the severity of local dryness, understanding which parts of the state are wet, dry, or near-normal across these different time periods provides context for the impact reports on the call, such as whether they’re driven by a few recent dry weeks or connected with more well-established dryness or drought.
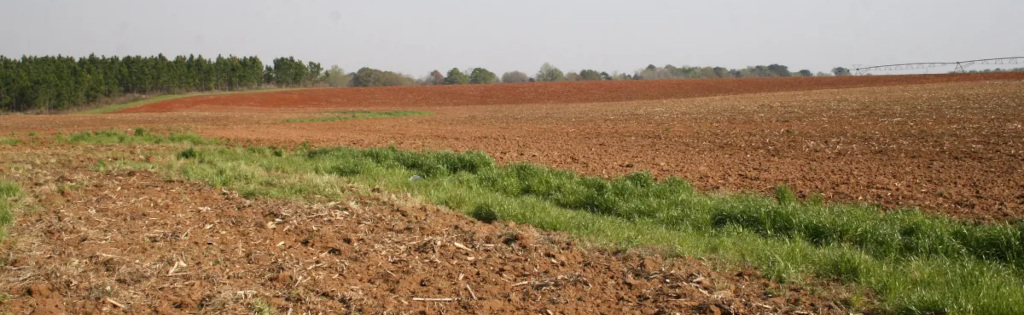
An ag landscape typical of the North Carolina Coastal Plain (by John A. Kelley, USDA NRCS)
Digging in to Soils and Groundwater
When it comes to ground-truth details about drought, one of the best sources is the ground itself. From the uppermost layer of topsoil to deep groundwater stores, they can tell us a lot about the degree of dryness and the impacts it’s having.
Short-term dryness is often first noticeable as a lack of topsoil moisture that may require plants to be watered manually or can cause the usual low-lying wet spots to become hard and cracked. If that dryness persists, it can work its way deeper, through the root zone and subsoil, and eventually affect aquifers and other groundwater sources.
Experts on the DMAC provide data about the full range of subsurface conditions, from the top down. First, representatives from the National Weather Service share modeled soil moisture from the NASA SPoRT-LIS program covering multiple layers: from the shallowest 10 centimeters to a full 2 meters, or more than 6 feet deep. This dataset also includes one-week and one-month changes to show trends in soil moisture over time.
Next, representatives from the US Geological Survey’s South Atlantic Water Science Center and the NC Division of Water Resources present groundwater observations the Climate Response Network and the Drought Indicator Network – two sets of wells designed specifically for drought monitoring. These networks include dozens of wells ranging from the deep bedrock of the mountains to shallow surficial wells along the coast. This ensures a broad sample of groundwater conditions at multiple depths and in multiple areas.
All of the soil moisture and groundwater data is framed in terms of historical percentiles, in keeping with the US Drought Monitor’s color-coded classification scheme. This aids with determining the severity of dryness and ensures an apples-to-apples – or, given that it’s all about the soil, perhaps potatoes-to-potatoes – comparison with other indicators.

Reading Rivers and Streams
After water infiltrates the soil or runs off from the ground, it eventually reaches the creeks, streams, and rivers that flow from their highland headwaters all the way to the ocean. Since they are all recharged by the rain, these waterways offer another useful indicator of environmental dryness.
Similar to taking the pulse in our bodies, assessing these rivers and streams amounts to measuring the rate of flow through them. This is called, fittingly, the streamflow or discharge, and is typically reported in cubic feet per second.
Crucially for drought monitoring purposes, the streamflow captures both the baseflow or springflow, which is the contribution from groundwater, and the surface water runoff, which results from rainfall that is not absorbed into the ground and reaches streams over land. Both can be affected by drought or dryness.
On the weekly DMAC calls, the USGS also shares streamflow data from dozens of gauges in the state, provided as real-time observations and as averages over the past 7 and 28 days, all classified by their percentiles.
This data helps paint the picture of our statewide water system and how it’s changing, such as whether low flows are a new occurrence or an ongoing phenomenon, and whether any dryness is isolated to a few streams or symptomatic of an entire watershed.
Unlike western states that can be covered by a single river and its tributaries, North Carolina has portions of 17 different river basins flowing through it. That adds to the importance of understanding local impacts and assessing the status of streams all across the state.

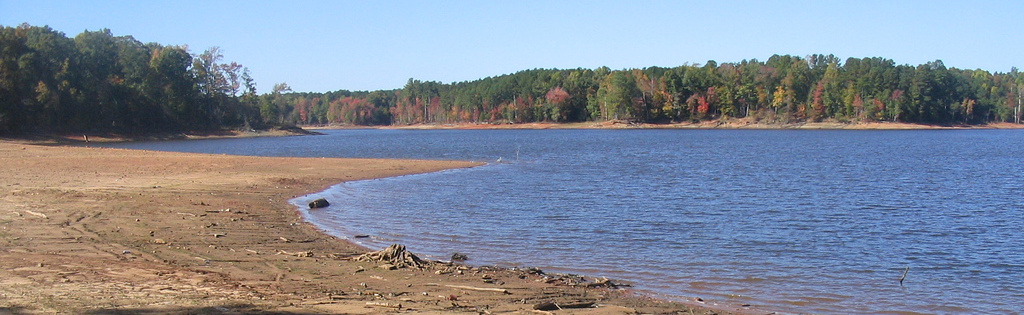
Lake Levels and Water Supplies
Water flowing down rivers doesn’t always reach the ocean uninterrupted. Lakes and reservoirs dot the waterways across the state where rivers were historically dammed to provide a measure of both flood control and drought resilience.
Our reservoirs are typically robust, recharging after capturing upstream rainfall with the flexibility to dial back downstream releases when we go through dry spells. Of course, longer dry periods – such as the 1998-2002 drought in which parts of the western Piedmont missed out on nearly a year’s worth of precipitation – can cause lake levels to drop significantly, which affects water supplies for the cities and towns that draw their drinking water from them.
For the DMAC, that adds special importance to monitoring reservoir levels, and that effort is supported by representatives from the US Army Corps of Engineers, Duke Energy, the Tennessee Valley Authority, and Cube Hydro, each of which manages reservoirs in parts of the state.
These different organizations measure their lake levels differently. Some report conditions compared to the full pond height, while others use a guide curve or target that may or may not fluctuate throughout the year. That’s where the DMAC’s expertise helps to assess any drought impacts, especially on local water supplies.
A representative from DEQ also reports directly about the status of public and municipal water systems to note any voluntary or mandatory conservation measures implemented or rescinded each week.
Impacts for Farms and Forests
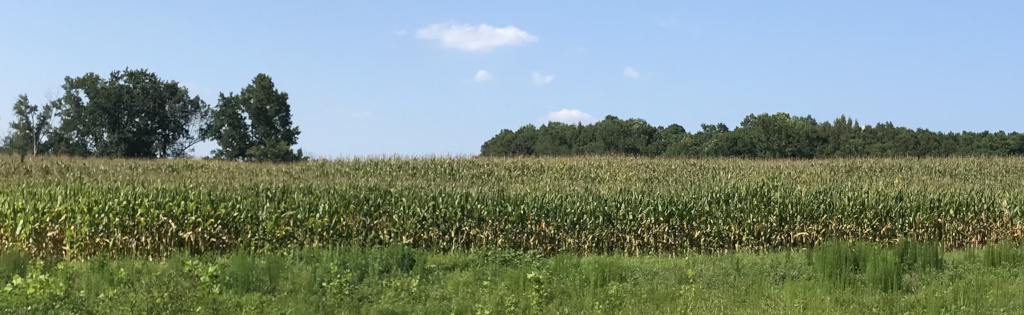
Data about weather, surface water, and groundwater conditions only goes so far in informing our drought assessment. Along with these objective indicators, drought is defined by its impacts, particularly to one of the largest pieces of North Carolina’s economy.
With a more than a $111 billion impact, agriculture and agribusiness are key sectors in our state, and each can rise and fall with the weather. Drought in particular represents a key vulnerability, particularly on the nearly 84% of farmland that is not irrigated.
Reflecting the sensitivity of agriculture to drought, the DMAC receives a summary of reports submitted by county extension agents and agronomists, and presented by a representative from NC State Extension. These reports highlight the degree of dryness and any observed impacts, which can be particularly useful at identifying emerging drought during the growing season.
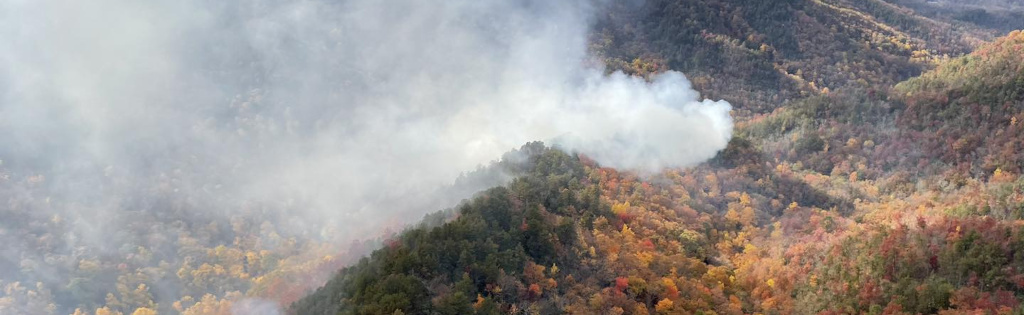
Drought can also have a noticeable impact on forested land when wildfires ignite, particularly during key times in the spring and fall when a lack of green vegetation increases the amount of flammable material in forests and allows more sunlight to penetrate the canopy and dry out ground-level litter and dead fuels.
On the weekly calls, a representative from North Carolina Forest Service reports recent wildfire activity and summarizes current fire danger conditions. These impacts can also help assess the severity of drought conditions across the state, as a more intense drought is typically associated with larger and more frequent wildfires.
Citizen scientists also help us track changing conditions. Volunteer observers from the CoCoRaHS precipitation monitoring program can submit weekly condition monitoring reports that highlight impacts in their backyard gardens, neighborhood streams and ponds, and local landscapes.
Seasonal Considerations
Drought manifests very differently in the warm-season compared to the winter, which adds to the challenge of assessing and validating conditions based on reported impacts. Recent droughts in North Carolina have given the DMAC experience with drought at all times of the year.
Drought is perhaps most commonly associated with the summertime since hotter temperatures make for higher evaporation rates and our typical precipitation pattern with hit-or-miss showers and thunderstorms can cause some unlucky areas to go without rain for days or weeks at a time.
These droughts are usually well-documented, as water levels will drop quickly and farmers and average citizens will notice when conditions begin to dry out. One challenge in recent years has been keeping pace with the often-rapid rate of degradations. Flash droughts have become more common and can see severe impacts emerge after only a week or so with hot, dry weather.
Droughts in the spring and fall can affect planting and harvesting for farmers, and increase the wildfire threat as vegetation greens up or loses its leaves. A spring drought that persists through the summer – as in 2007 – can lead to widespread water supply impacts, while those concerns are generally lower during the fall since even average precipitation in the wintertime is usually enough to recharge our lakes and rivers.
Winter droughts are among the toughest to monitor since vegetation – including most crops – are dormant and water demands for irrigation, car washing, and other outdoor activities are reduced. In a drought lasting from fall into the winter, objective indicators such as the percent of normal precipitation, streamflows, and groundwater levels can highlight the severity of an ongoing drought, and a little rain (or snow) can go a long way toward bringing improvements.

Reaching a Consensus
After reviewing these many different indicators and impacts, it’s up to the DMAC to determine the weekly drought status for North Carolina, which serves as the official recommendation to the US Drought Monitor.
Inevitably, not all indicators will agree with each other. For example, an area that has had near-normal rainfall over the past two weeks can still have drought or dryness and its associated impacts present over the past three months.
Coming to a conclusion therefore requires finding the areas and timescales over which there is consistent agreement. This is called the convergence of evidence approach, and it’s a bit like a detective piecing together clues to solve a mystery.
If multiple indicators highlight a similar level of dryness – say, conditions around the historical 15th percentile – and that is backed up by impacts typical of the first stages of drought at this time of year, then it suggests Moderate Drought (or the D1 classification on the US Drought Monitor) is present over that area.
In cases where indicators strongly disagree, such as if an area is wet in the short term and dry in the longer term, then the impact reports become even more important. For instance, if farmers are still noticing reduced crop yields and deeper soil moisture or groundwater levels have not fully recovered, then Abnormally Dry (D0) conditions or some degree of drought is likely still present, even if the ground surface may be wet. As we sometimes say about scenarios like this, drought is not just skin deep.
Once agreement is reached based on this review of the data, and the lines on the map are adjusted to reflect the latest assessment, those are sent as recommendations to the US Drought Monitor authors, who consider many of the same objective indicators and local input from many states in crafting the weekly national map.
But in North Carolina, the work isn’t done at the end of our Tuesday afternoon call. Communicating with the public is an important part of the DMAC’s charge, and recent NOAA-funded work by the State Climate Office and the Carolinas Integrated Sciences and Assessments program led to the development of a weekly drought update infographic explaining current drought status and key impacts across the state.
These images are shared with a listserv of stakeholders and posted to the DMAC website each Thursday morning to make sure the people affected most by drought have access to the latest insights and assessments every week.